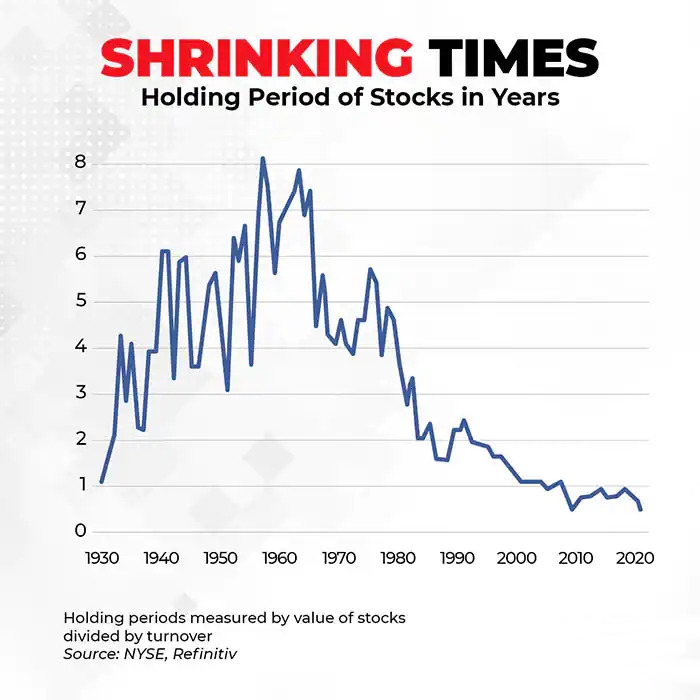
The average holding period of a stock has been dropping for decades now. Data from the New York Stock Exchange shows that compared to an average holding period of almost eight years in the 1960s, the average holding period has now fallen to less than six months. While some of this decline may be attributable to high-frequency trading, the overall trend is unmistakable.
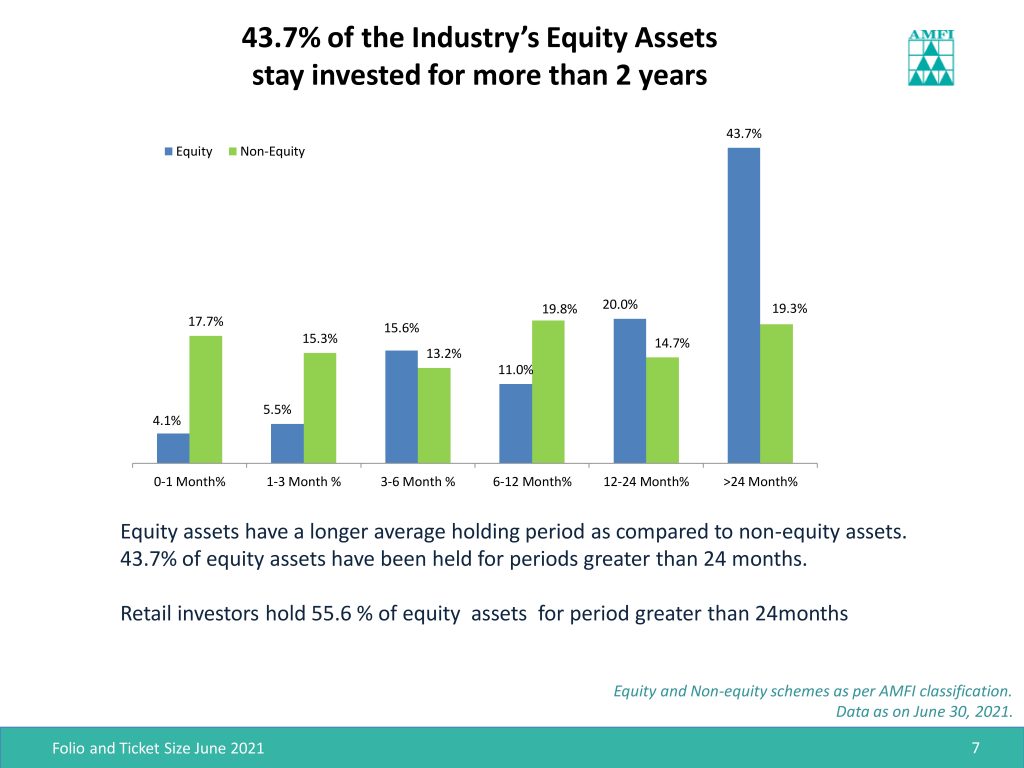
The Association of Mutual Funds in India estimates that less than 45 percent of equity mutual fund investors hold on to their investments for more than two years, with almost 25 percent exiting in less than six months.
So why do most investors not stay the course with their equity investments? The clues may lie in investor behaviour with other asset classes.
Consider a fixed deposit. It would be fair to assume that more than 95 percent of investors stick on till maturity. For most of us ‘liquidating a FD’ is seen as a sign of financial distress, and has to be avoided as far as possible. Or take real estate. Owners of most investment properties wait for at least a few years before flipping them in the market. In the Indian context, gold is held on to for generations.
Why do Buffett-isque ‘Buy and Hold’ers for other asset classes suddenly become Soros-isque fast traders when it comes to equities? The answer lies in the fact that compared to all other asset classes mentioned above, equities suffer from higher volatility. Rs 100 invested in 6 percent fixed deposit will reach Rs 106 in a year’s time in a straight line with zero volatility. An equity exposure could reach Rs 115 in a year, but in the interim may go to Rs 80 or Rs 130, and that’s what causes investors to trade much more. What makes it worse is that the equities are the most liquid asset class, and, therefore, easy to trade in and out of.
If that’s the nature of the beast, shouldn’t lay folk stay away from it? At least my Maruti 800 won’t become a Hero Splendor. The chart that follows is quite instructive in answering the question. Across various time periods, an index of large-cap stocks has provided returns well in excess of FDs. However, in shorter time frames that return has been accompanied by significant volatility.
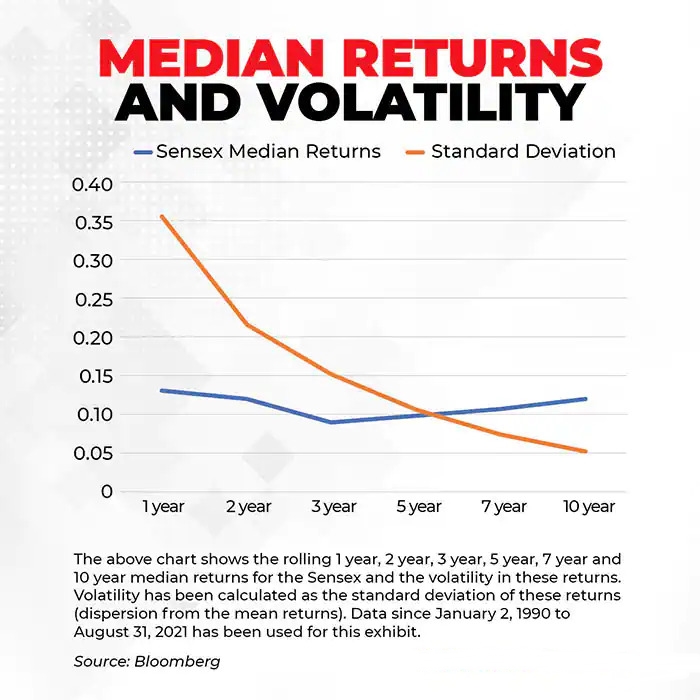
For instance, take the one-year numbers. The median return of 13 percent is quite acceptable, but the 36 percent volatility is not. What it means is that there is a 67 percent chance that your annual returns would be in the range of 49 percent and -23 percent. That kind of volatility can be gut-wrenching even for professional investors.
The good news though is that as your holding period increases volatility goes down. Consider the same numbers at a 10-year horizon. While the median return is a similar 12 percent per annum, volatility drops significantly to just over 5 percent. What this means is that by remaining invested for a decade, there is a large (67 percent) probability that your return range will be between 7 percent and 17 percent. The lower end of this range is comparable if not better than most FD products. The key to making superior risk-adjusted returns in equities is to ‘stay the course’, and here we are just talking about an index. An active manager can construct a portfolio that offers better returns than a headline index and with lower volatility.
‘Staying the course’ falls in the bucket of things that Charlie Munger succinctly calls ‘simple but not easy’. How do you hold your nerve in the midst of scrolling ticker tapes, flashing lights of ‘Breaking News’, and the itch to ‘time’ the market? Every investor should figure out their own process to do this.
