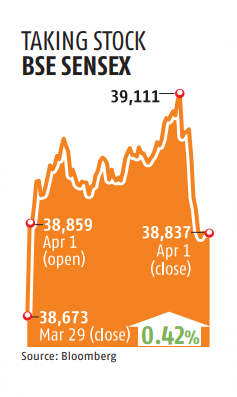
On 01.04.2019, as the sensex went over the 39,000 mark for the first time in its history, it also quietly crossed another landmark. It was exactly 40 years ago, on April 1, 1979, that the sensex was technically born. On that day, it had started its journey on Dalal Street with a base value of 100 points. In effect, in 40 years, the sensex has risen 390 times. Seen another way, if one had invested Rs.1 lakh in the index on that day, the investment would have been worth an astonishing Rs.3.9 crore today.
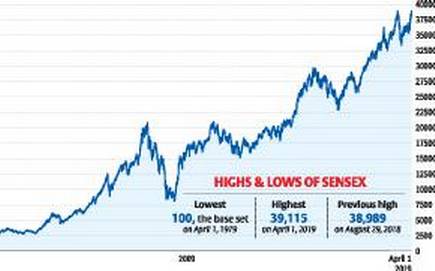
Although born on 1979, the BSE started publishing the value of the sensex from 1985 when it was in the 400-point range. The same year it had given the highest annual returns, 94%.
The tremendous returns generated by the sensex is a testimony to the power of wealth creation of the stock market, provided the investor is able to withstand the ups and downs that the market throws up once in a while. Also, for investors, it is not advisable to look at stock prices frequently.
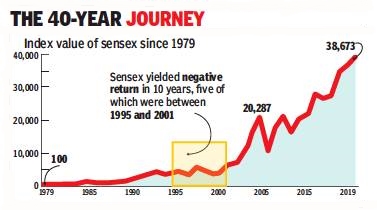
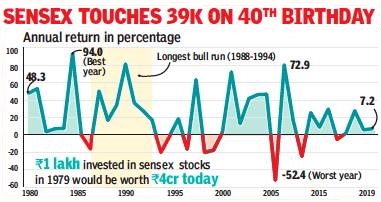
Over the last 40 years, India has been witness to the assassination of one Prime Minister and one ex-PM, testing of nuclear bombs, two major stock market scams, a war and several major border skirmishes with Pakistan, terror attacks like 9/11 and 26/11, pledging of golds to avoid sovereign debt default and fall of governments at the centre. Yet for the index, over these 40 years, the average annual return was a little over 16%. In comparison, according to some estimates, bank FDs of one year duration would have given annual average returns of about 7% while the returns from gold would have been in the 9% range.
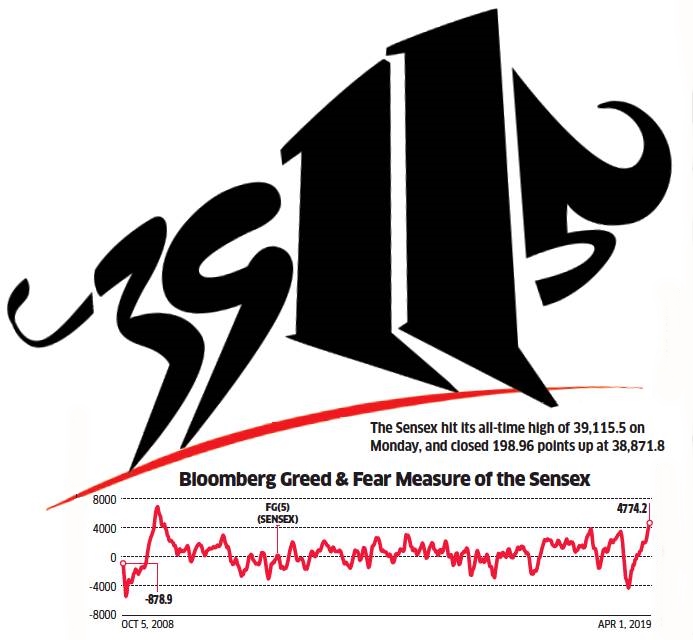
Irrational exuberance is more than the first word in capturing the interplay of greed and groundless optimism that takes stocks to the stratosphere. And exuberance seems to be in abundance in Mumbai these days, with the Bloomberg gauge on Greed and Fear showing its most optimistic reading since in the aftermath of the 2009 global financial meltdown.
The pendulum has swung decisively from extreme pessimism in October 2018 to the opposite end, the amplitude perhaps indicating that it is time to be a bit more cautious on local equities.
Similarly, another momentum indicator, the Relative Strength Index, also suggests that the market is entering the overbought zone. The RSI is at 74.25. Any reading above 70 indicates overbought levels for stocks, and less than 30 is seen as the oversold zone.
Furthermore, the 4774 reading of the Bloomberg Greed and Fear index is two standard deviations from the 10-year average, indicating the singularity of price moves in comparison with the mean or a central measure. Statistical theory suggests that about 95% of all price moves of a security or index are within one standard deviation.
